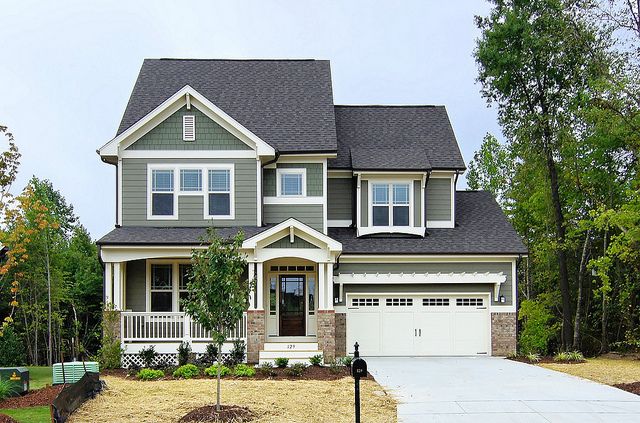
What is the Average House Price in Orangeville?
Housing Market Report for January 2026
Answer: The average price of a house in Orangeville is $677,286 with 19 new listings appearing in the past 28 days. The data on Orangeville’s housing market reveals that the median time a property spends on the market is 52 days according to current Orangeville MLS® stats.

Orangeville Housing Stats
Dec 05 – Jan 02
$677K
Avg Sold Price
$595
Median $/Sq.Ft
14.1%
Monthly Change
11.5%
Quarterly Change
14.5%
Yearly Change
| # Beds | Dec 05 – Jan 02 | 3 mo ago | 6 mo ago | 1 year ago |
|---|---|---|---|---|
| 2 Bd | $584K -33% | $705K | $783K | $875K |
| 3 Bd | $747K -19% | $833K | $818K | $920K |
| 4 Bd | n/a | $1.1M | $975K | $1.1M |
| 5 Bd | n/a | n/a | n/a | n/a |
| 6 Bd | n/a | n/a | n/a | n/a |
| All | $714K -21% | $879K | $823K | $900K |
| # Beds | Dec 05 – Jan 02 | 3 mo ago | 6 mo ago | 1 year ago |
|---|---|---|---|---|
| 1 Bd | n/a | n/a | n/a | n/a |
| 2 Bd | n/a | $495K | $502K | $542K |
| 3 Bd | $585K -21% | $669K | $688K | $739K |
| 4 Bd | n/a | $683K | $653K | n/a |
| All | $585K -9% | $660K | $669K | $640K |
| # Beds | Dec 05 – Jan 02 | 3 mo ago | 6 mo ago | 1 year ago |
|---|---|---|---|---|
| Studio | n/a | n/a | n/a | n/a |
| 1 Bd | n/a | $434K | $352K | $490K |
| 2 Bd | n/a | $630K | n/a | $519K |
| 3 Bd | n/a | n/a | n/a | n/a |
| All | n/a | $499K | $352K | $505K |
Orangeville Housing Inventory
19
new listings
(last 28 days)
7
homes sold
(last 28 days)
52
average days on market
95%
selling to listing ratio
| # Beds | New Listings | Sold Listings | Active Listings | Days on Market | Sale to List |
|---|---|---|---|---|---|
| 2 Bd | 0 -100% | 1 0% | 5 +25% | n/a | 0% |
| 3 Bd | 9 +13% | 4 -50% | 36 -16% | n/a | 0% -100% |
| 4 Bd | 2 -67% | 0 -100% | 19 +46% | n/a | 0% |
| 5 Bd | 0 | 0 | 3 +200% | n/a | 0% |
| 6 Bd | 0 -100% | 0 | 0 -100% | n/a | 0% |
| All | 11 -35% | 5 -53% | 65 -4% | n/a | 0% -100% |
| # Beds | New Listings | Sold Listings | Active Listings | Days on Market | Sale to List |
|---|---|---|---|---|---|
| 1 Bd | 0 | 0 | 0 | n/a | 0% |
| 2 Bd | 0 | 0 -100% | 1 -50% | n/a | 0% |
| 3 Bd | 7 +133% | 2 0% | 31 +48% | n/a | 0% |
| 4 Bd | 2 +100% | 0 | 6 +200% | n/a | 0% |
| All | 9 +125% | 2 -50% | 38 +31% | n/a | 0% |
| # Beds | New Listings | Sold Listings | Active Listings | Days on Market | Sale to List |
|---|---|---|---|---|---|
| Studio | 0 | 0 | 0 | n/a | 0% |
| 1 Bd | 0 -100% | 0 -100% | 3 -57% | n/a | 0% |
| 2 Bd | 1 -10% | 0 -100% | 3 -50% | n/a | 0% |
| 3 Bd | 0 | 0 | 0 | n/a | 0% |
| All | 1 -75% | 0 -100% | 6 -54% | n/a | 0% |
Orangeville Rankings out of 23 in Greater Toronto
23rd
Most expensive
8th
Fastest Growing
21st
Fastest Selling
24th
Highest Turnover

Jennifer Jewell Get in touch with Jennifer here.


